
In the era of artificial intelligence, we are more productive than ever. With a single prompt, we can generate code, write copy, compile research, and design graphics. But this convenience comes with a hidden cost: energy and carbon emissions. Behind every query to an AI model lies a massive data center humming with electricity, consuming water, and generating carbon dioxide.
To bridge the gap between our digital workflows and their environmental footprint, we are excited to introduce Tech Energy Usage, a lightweight, privacy-first desktop widget designed to track and visualize your computer's real-time carbon emissions and energy consumption.
Developed by the team at Real Code Ltd, this open-source application helps you monitor the environmental impact of your daily computer tasks—focusing specifically on your active applications and your direct interactions with generative AI.
🎨 What is Tech Energy Usage?
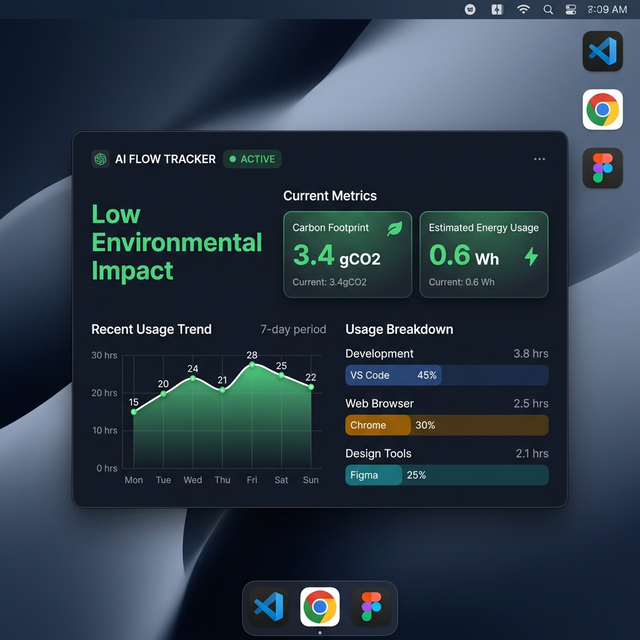
Tech Energy Usage is a background-friendly desktop dashboard that grades your environmental impact in real-time. Designed to be unobtrusive yet informative, it sits on your desktop or in your system tray, shifting its visual state dynamically:
- 🟢 Green (Low Impact): Optimal workflow with minimal resource-heavy tasks and minimal AI requests.
- 🟡 Amber (Moderate Impact): Normal workflow with moderate CPU/GPU compute or occasional AI consumption.
- 🔴 Red (High Impact): Resource-intensive work or frequent AI interactions driving up cumulative energy consumption.
The interface gives you a breakdown of:
- Active Time: Total time tracked during your current computer session.
- Carbon Footprint: An estimate of grams of CO₂ (gCO₂) emitted based on your usage.
- Estimated Energy: An approximation of the Watt-hours (Wh) your machine and network requests have consumed.
- App Category Breakdown: A detailed, interactive chart showing where your time, energy, and carbon are going.
⚙️ How It Works under the Hood
Tech Energy Usage is built using a modern, efficient desktop stack: Rust (via Tauri) on the backend and React + TypeScript (via Vite) on the frontend. This ensures high performance, minimal memory usage, and native system integration.
Here is how the application tracks your impact:
1. Active Window Tracking
Every 10 seconds, a background loop in Rust queries the operating system for the active window's title and process executable name (using the lightweight active_win_pos_rs crate). It then matches these details against user-configurable rules in categories.json to assign the application to a category, such as:
- Development Environments (IDE compiling, code indexing)
- Web Browsers (Browsing, network-heavy activity)
- Design Tools (Heavy GPU-assisted rendering)
- Office Software (Lightweight typing, editing notes)
Each category has a customizable hourly energy footprint (Wh) and carbon footprint (gCO₂) multiplier to match your hardware profile.
2. Network Sniffing for AI Calls (Windows Only)
To count AI interactions, the app launches a passive packet-capture thread (utilizing Npcap). It monitors outbound TCP packets over port 443 (HTTPS).
To ensure security, the app does not decrypt or read the contents of your communications. Instead, it reads the outermost packet envelope—specifically the plaintext Server Name Indication (SNI) in the TLS handshake. It checks if the destination domain matches known AI endpoints (such as api.openai.com, api.anthropic.com, claude.ai, or gemini.google.com).
Every match is recorded as a single AI API call, which carries a default environmental estimate of 3.0 Wh and 4.3 gCO₂ per call.
3. Grid-Aware Carbon Intensity Scaling
Not all electricity is created equal. Running a computer in a region powered by coal produces far more carbon than running the same computer in a region powered by solar or wind.
Tech Energy Usage includes a Carbon Region Selector in the Settings panel. You can select your region (e.g., USA, UK, India, Germany, France, or Norway), and the app will scale your carbon footprint estimates based on the local grid's average carbon intensity (measured in gCO₂/kWh). For example, choosing Norway (28 gCO₂/kWh) vs. India (708 gCO₂/kWh) dynamically adjusts your carbon estimations, while keeping energy (Wh) calculations absolute.
🔒 Privacy First by Design
We understand that a background tracking application can raise concerns. That is why Tech Energy Usage is built with strict privacy guarantees at its core:
- 100% Local Storage: All usage data, window titles, network timestamps, and configurations are stored locally on your machine in JSON Lines (
.jsonl) format. - Zero Telemetry: The app never sends your usage history, chat logs, browsing history, or document names to Real Code Ltd, your employer, or any third-party cloud servers.
- Safe Network Capture: Because it only reads SNI headers during the TLS handshake, it cannot read what you are writing to the AI or what it is replying back to you.
🚀 Get Started and Download
Ready to start tracking your tech consumption? You can download the latest installer for Windows (.msi) or macOS (.dmg) directly:
👉 Download the Latest Release on GitHub
Note for Windows users: The AI/network call tracking feature requires installing the free networking utility Npcap and running the application with Administrator privileges.
🤝 Open Source & Collaboration
Tech Energy Usage is free, open-source, and licensed under the MIT License. We welcome contributions, feature requests, and bug reports from the developer community.
If you want to view the source code, customize categories, build a custom plugin, or help us port network-tracking features to macOS, check out our repository:
👉 Collaborate and View the Source Code on GitHub
Quickstart for Developers:
bash# Clone the repositorygit clone https://github.com/Real-Code-Ltd/tech-consumption.git# Install dependenciesnpm install# Run the app in Tauri development modenpm run tauri dev
Let's make our digital workflows cleaner, one prompt at a time!